DIRECT DEBUGGING
Overview
This section of the documentation discusses the manual specification of a debug output file to a schematic for simulation and debugging purposes.
If you are working with the VSM Studio IDE then this is automated and the following discussion does not apply.
The Source Code Window
The source code window is the primary tool for debugging your designs in Proteus and allows you to single step your program, advancing the entire embedded system as you debug your software. Your program is loaded into the source window via the debug file output by your compiler. When using a compiler you should provide the debug file to the schematic part via the Program property inside the Edit Component dialogue form, as shown below:

Loading an *.ELF program file
One of the most common errors people make is to supply the program file as a .HEX file and then query why they have no source level debugging. In order to provide source level debugging we need more information on addresses, high level source lines, variables etc. and so you should only use a .HEX file if you are either writing in assembler or if your tool cannot output any of the supported debug formats (which is extremely unlikely!).
When you start the simulation using the Pause button on the Animation Control Panel the source window will appear by default, typically looking like the snapshot below. The message reads 'No source line at address' followed by the program counter value, and it appears because the simulation time is zero and the program counter at that time does not point to an executable line of code.
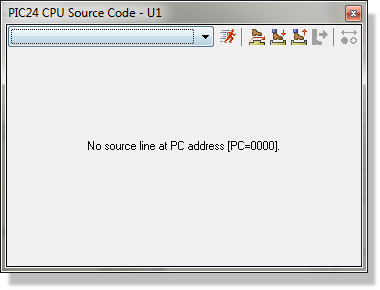
At the start of simulation the code is loaded
You can of course select the source file you want from the drop down list at the top of the source window and then single step or set breakpoints as required.
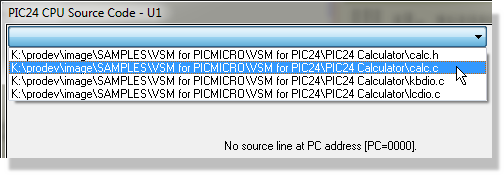
Loading the Calculator code
If you are using a high level language you can single step at either high level or machine code level. To toggle machine code stepping use the Display Disassembly option on the source window's context menu (right click on the source window).
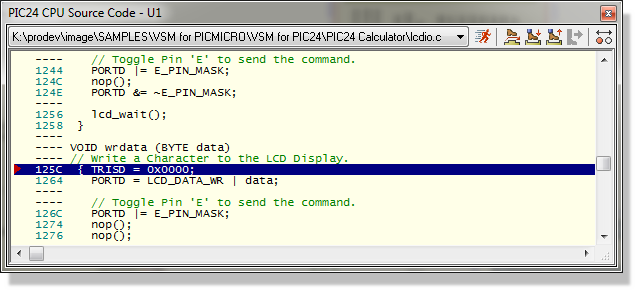
Stepping through the code
The same context menu carries Display Address and Display Opcodes, which show or hide the address and opcode columns beside each line. Line numbers are not controlled from here: they are a text editor setting, held under VSM Studio's text editor display settings as the Display line numbers option, and they are shown by default.
Supported Debug Formats
Proteus reads the debug output of a wide range of toolchains. Which formats a given design can use is decided by the processor model, not by Proteus as a whole, so the first thing to establish is what your processor family accepts. The table below lists that, and the sections after it describe each format in turn.
Program Files by Processor Family
| Processor family | Program file extensions accepted | What you get |
| 8051 | .OMF .CDB .UBF .D03 .HEX | OMF51 (Keil), CDB (SDCC) and UBROF (IAR) all give source level stepping and variable display. |
| AVR | .ELF .COF .OBJ .UBF .D90 .DBG .HEX | ELF/DWARF and COFF give source level stepping, variables and scope information. .OBJ is the AVR Studio object format, which is also what BASCOM-AVR produces. |
| ARM7 (LPC2000) | .ELF .OUT .AXF .UBF .D79 .DBG .HEX | ELF/DWARF gives source level stepping, variables and scope information. .OUT and .AXF are ELF files under another name. |
| Cortex-M0, Cortex-M3, Cortex-M4 | .ELF .AXF .COF .D90 .DBG .HEX .BIN | ELF/DWARF gives source level stepping, variables and scope information. On the Cortex-M4 it also drives a stack window, so you can select a calling frame and see its locals. |
| MSP430 | .ELF .COF .D43 .DBG .HEX | ELF/DWARF and COFF give source level stepping, variables and scope information. |
| C2000 (Piccolo) | .ELF .COF .D90 .DBG .HEX | ELF/DWARF and COFF give source level stepping, variables and scope information. |
| PIC10 | .COF .COD .BAS .HEX | COFF is the format to prefer. COD gives source level stepping and variables but no scope information. |
| PIC12, PIC16 | .COF .COD .BAS .UBF .D39 .HEX | COFF is the format to prefer. COD gives source level stepping and variables but no scope information. |
| PIC18 | .COF .COD .BAS .UBF .D39 .D49 .ELF .HEX .BIN | COFF is the usual choice. ELF/DWARF is accepted as well; if a particular PIC18 part reports that the program file type is not supported, use the COF file instead. |
| PIC24, dsPIC | .COF .COD .BAS .UBF .D49 .HEX .BIN | COFF is the format to prefer. COD gives source level stepping and variables but no scope information. |
Two notes on the table. The .Dnn extensions are all UBROF: IAR names its debug file after the target, so the same format arrives as .D03, .D39, .D43, .D49, .D79 or .D90 depending on the family, and each family takes its own. And a .HEX file, or a raw .BIN image, carries machine code and nothing else: the program will run, but there is no source, no line information and no variables. One legacy exception survives from the assembler toolchains of twenty years ago: a .HEX file accompanied by a matching .SDI file in the same folder regains source line stepping. It is mentioned here for the benefit of very old assembly language projects; new work should use one of the debug formats above.
Motorola S-record files (.S19) are read as well, but as a way of loading the contents of a memory device such as a ROM or RAM part rather than as a processor debug format.
ELF/DWARF
This is the recommended debug format for use with Proteus, being both rich in detail and generic. It is produced by most modern compilers. To use it with Proteus simply specify the ELF file as the Program property in the schematic part for the processor.
ELF/DWARF is read by the AVR, ARM7, Cortex-M0, Cortex-M3, Cortex-M4, MSP430, C2000 and PIC18 models. On the other PIC families, that is PIC10, PIC12, PIC16, PIC24 and dsPIC, use COFF or COD instead.
Both the ELF (the binary file) and the DWARF (the debug file) must exist in the same directory. This should happen by default when you select ELF/DWARF as the debug format from within your compiler.
COFF
This format, while supported, is not recommended where an ELF/DWARF option is available. This is because, unlike ELF/DWARF, the COF format is somewhat compiler dependent and open to interpretation. This means for example that a PIC compiler may represent a float in COF as an IEEE float or in Microchip's float format, and provides no explicit information as to which format it has used. To use COFF with Proteus, specify COF as the debug format within the compiler and then use the .COF file in the Program property of the processor's Edit Component dialogue form.
Where a floating point value is displayed wrongly because of that ambiguity, add the variable to the watch window and set its data type explicitly: the Data Type menu there offers HiTech Float and Microchip Float alongside the IEEE types. See Modifying Items in the Watch Window.
UBROF
UBROF is the debug format of choice produced by the IAR compiler range. Specify UBROF8 (not a later version) as the debug format within the compiler and then use the UBROF file as the Program property of the processor's Edit Component dialogue form.
You can also drive Proteus directly from within IAR's Embedded Workbench. See Proteus VSM for IAR Embedded Workbench.
OMF51
OMF51 is the debug format produced by Keil compilers, and it is supported for the 8051 family only. Specify standard OMF51 as the debug format within the compiler and then use the .OMF file as the Program property of the processor's Edit Component dialogue form.
Newer versions of the Keil compilers will also produce ELF/DWARF and we recommend you use this option where available.
You can also drive Proteus directly from within Keil. See Proteus VSM for the Keil uVision IDE.
CDB
CDB is the debug format written by SDCC, the free 8051 toolchain. Specify the .CDB file as the Program property of the processor's Edit Component dialogue form. Source level stepping and variable display are both available.
COD
COD is a debug format produced by Bytecraft and widely used in PIC circles. Source line stepping and variable display do both work, but COD carries no variable scope information, so every variable is treated as a global. The variables window cannot then show you only the variables currently in scope, and the Show Globals option makes no difference to what is listed. Prefer COFF, or ELF/DWARF where the family supports it, if your toolchain will produce one.
To use COD with Proteus specify COD as the debug format within the compiler and then use the COD file as the Program property of the processor's Edit Component dialogue form.
BAS
Proteus provides a custom solution for Crownhill's Proton Development Suite. After compiling your program simply specify the .BAS file as the Program property in the Edit Component dialogue of the PIC processor.
Do not enter the name of the source file as the Program property for a processor. Proteus VSM does not simulate 'C' or 'ASM' files; the CPU models load and execute binary machine code from the debug formats specified above.
The VSM Studio IDE is included with all copies of Proteus. It will automatically detect your compilers, configure them to output the correct debug format and then send the object file to the simulator for you. The list of toolchains it recognises is given on its Supported Compilers page.
Single Stepping and Run Control
A number of options for single stepping are provided, all available from the Debug menu, from the keyboard, and (with one exception) from the toolbar on the source window itself. The toolbar buttons carry shorter names than the menu commands, so both are given below.
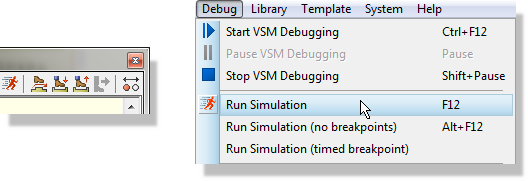
Step commands under the Debug menu
| Debug menu command | Shortcut | Source window button | What it does |
| Step Over Source Line | F10 | Step Over | Advances by one line, unless the instruction is a subroutine call, in which case the entire subroutine is executed. |
| Step Into Source Line | F11 | Step Into | Executes one source code instruction. If no source window is active, it executes one machine code instruction. These are usually the same thing anyway unless you are debugging in a high level language. |
| Step Out from Source Line | CTRL+F11 | Step Out | Executes until the current subroutine returns. |
| Run To Source Line | CTRL+F10 | Step To | Executes until the program arrives at the current line. This command is only available when a source code window is active. |
| Animated Single Step | ALT+F11 | Single steps repeatedly, so that you can watch execution advance through the code and the schematic animate alongside it. |
Note that apart from Run To Source Line, the single stepping commands will work without a source code window. It is possible, although not so easy, to debug code generated by a tool for which there is no loader support.
Running the Simulation
| Debug menu command | Shortcut | What it does |
| Start VSM Debugging | CTRL+F12 | Starts the simulation and stops it at the first source line, ready to step. |
| Run Simulation | F12 | Free runs the simulation until a breakpoint is hit or you pause it. This is the same as the Run button on the Animation Control Panel. |
| Run Simulation (no breakpoints) | ALT+F12 | Free runs the simulation with every breakpoint ignored, which saves disabling them one at a time when you want to get past them. |
| Run Simulation (timed breakpoint) | Runs for a period you specify and then suspends. See Execute for specified time. | |
| Pause VSM Debugging | PAUSE | Suspends the simulation, or starts it up at time zero if it is stopped. |
| Stop VSM Debugging | SHIFT+PAUSE | Ends the simulation run. |
Pressing ESCAPE while a simulation is running also breaks out of it, which is the quickest way to regain control of a design that is running away with itself.
Debug > Reset Persistent Model Data clears the saved state that models carry between runs. If a simulated EEPROM or data flash starts a run with data in it that you did not put there, this is the command that clears it. See Persistent Model Data.
Using Breakpoints
Breakpoints provide a very powerful way to investigate problems in the software or software/hardware interaction in a design. Typically, you will set a breakpoint at the start of a subroutine that is causing trouble. There are two ways to set a breakpoint.
1) If you think you know where the problem lies, then you can simply right click on the line and toggle a breakpoint via the context menu. Alternatively you can left click on the left of the line number.
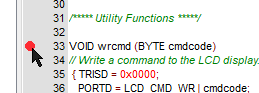
A breakpoint set before the simulation is started
2) Start the simulation by pressing the Pause button, then load the correct file from the drop down box at the top, then set the breakpoint as above. Press Run and the program will pause when the breakpoint is triggered. At this point, the simulation will be suspended in time. Thereafter you can single step the program code, observing register values, memory locations and other conditions in the circuit as you go. Turning on the Show Logic State of Pins effect can also be very instructive.
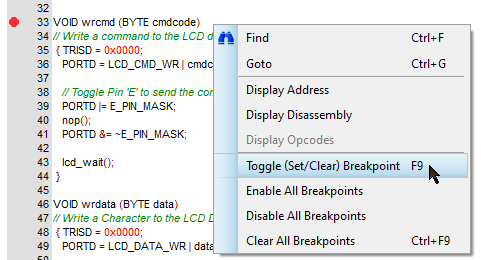
A breakpoint set during a simulation run
A breakpoint may be set on any line. When the program is loaded the breakpoint binds to the first line at or after the one you marked which actually carries object code, and the marker moves accordingly. Breakpoints are stored against the source file and line number rather than against an address, and they are resolved to an address afresh every time the program is rebuilt, so editing and recompiling your code does not normally disturb them. If the line you marked no longer carries object code, the breakpoint moves forward to the next line within twenty that does; beyond that it cannot be resolved and will not fire.
When a source code window is active the context menu carries four breakpoint commands, all of which also work from the keyboard. Toggle (Set/Clear) Breakpoint sets or clears a breakpoint on the current line and is bound to F9. Enable All Breakpoints and Disable All Breakpoints switch the whole set on or off without losing any of them, which is useful when you want to run past them once and then carry on. Clear All Breakpoints removes them entirely and is bound to CTRL+F9.
Left clicking on the red dot will toggle Set / Disable / Clear.
If you are debugging from inside VSM Studio, the Breakpoints window lists every breakpoint in the project with its file, address and project, and lets you enable or disable each one from the list. See Breakpoints in the VSM Studio documentation.
Variables Window
Every processor model creates a variables window alongside its source window. How much that window can show you depends on the debug format your compiler produced, so see Supported Debug Formats above if it is emptier than you expect.
The variables window is an extremely powerful debugging aid and provides a number of customisable features to make it easier for you to access and understand the information displayed.
Expansion of Compound Types and Pointers
The variables window will seamlessly handle compound types (structs, arrays, enums) and pointers, providing an expandable tree displaying the contents of the type or the de-referencing of the pointer.
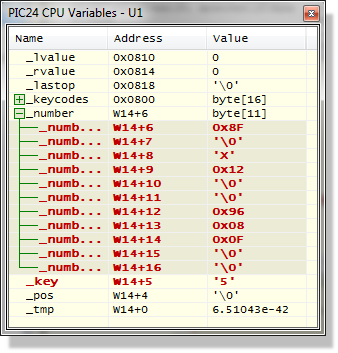
The Variable window
The information loaded into the variables window is provided by the object module file produced by your compiler. As with most things, some formats are better than others. Where possible we recommend using ELF/DWARF as the output format from the compiler and specifying the .ELF file within the schematic part. Failing that, the COFF format can be used and should provide full variables support.
Change Notification and Previous Values
A variable in the variables window will highlight when the value of that variable changes and the simulation is paused. You can also view the previous value of the variable by selecting the Show Previous Values? option from the context menu (right click on the variables window).
If you have a compound type (such as a struct) and an element of the type changes then only that element will highlight. This means that, unless the type is expanded, you will not see a change in the variables window at the point the element changes.
Moving Variables to the Watch Window
Although the variables window is hidden while the program is running, you can drag and drop variables onto the watch window where they will remain visible during free running simulation. The context menu offers the same transfer as an Add to Watch Window command, which is usually easier than dragging. Either way, this has the added advantage of then being able to set a watch condition on the variable to pause the simulation when the condition is reached.
Pointers are the one exception. They cannot be moved to the watch window and Proteus will tell you so:
'You cannot add pointers to the Watch Window. However, you can expand the pointer (in the variables window) and add the de-referenced item (the item pointed to) to the Watch Window.'
If you drag a variable to the watch window and the variable then goes out of scope (or indeed, if you then recompile the program and re-simulate) then there is no guarantee that you will be viewing the contents of the variable in the watch window. This depends on how the compiler re-uses memory. The watch window simply monitors an address in memory.
Hiding and Showing Global Variables
With large programs you may have quite a number of global variables. The Show Globals? option, found on the context menu (right click on the variables window), will allow you to hide all the globals, making it easier to focus on the local, in scope variables. It has no effect on a program loaded from a COD file, because COD carries no scope information and every variable is therefore treated as a global.
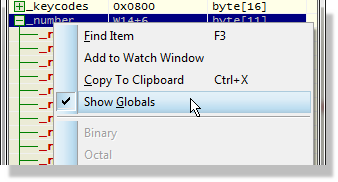
The Show Globals option on the variables window context menu
Font and Colour Configuration
Right clicking on the variables window and selecting the Set Colours... option presents a dialogue form allowing you to specify custom colours for all variable window items. Set Font... on the same menu changes the typeface and size.
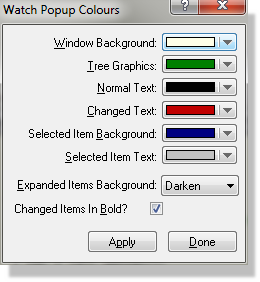
Custom colourisation
Debugging from an External IDE
Proteus can be driven from outside, so that your IDE downloads firmware, sets breakpoints and steps through source against the running simulation exactly as it would against a physical board. The simulation stands in for the silicon and for the debug probe.
The switch that opens the door is Debug > Enable Remote Debug Monitor. It must be turned on before a design is loaded: the command is only available while nothing is loaded, so if it is greyed out, close the design, set the option, and open the design again. With it on, Proteus listens for a debug client and hands control of the run to whatever connects.
Two families of client are supported. The Virtual Debug Monitor serves the IDE-specific drivers, and there is a driver for IAR Embedded Workbench, for the Keil uVision IDE, for MPLAB and for AVR Studio. Separately, the Cortex-M models expose a GDB Remote Serial Protocol server, which any GDB-compatible front end can talk to.
Example: Driving the Simulation from a GDB Front End
This example uses STM32CubeIDE, but the sequence is the same for any GDB client.
- With no design open, select Debug > Enable Remote Debug Monitor.
- Open the schematic. It must use a Cortex-M part: the GDB server serves the Cortex-M models only and will refuse a connection for anything else.
- In STM32CubeIDE, create a GDB Hardware Debugging configuration for your project and point its remote target at localhost port 3333, which is where the server listens by default.
- Start the debug session. The IDE loads the ELF into the simulated target, starts the simulation and halts at your first breakpoint. From there, resume, suspend, stepping, registers, variables and memory all work as they would against real hardware.
The same approach works from VS Code with the cortex-debug extension, from Keil Studio, from Eclipse CDT and from the bare arm-none-eabi-gdb command line. The per-model documentation covers the configuration in full, including where to find the GDB executable and what to do when a connection will not come up.
Multi-CPU Debugging
Proteus VSM has no problem simulating designs containing more than one CPU on the schematic. Each CPU will produce its own set of popup windows including source code and variables, and these will be grouped together under sub-menus on the Debug menu.
When single stepping code, the processor whose source window has the focus will be treated as the master, and the other CPUs will free run, suspending their execution at whatever time-point the master CPU has completed an instruction. If you move the focus away from the source window, then the master CPU remains the one whose source window last had the focus; the master is changed by clicking on another CPU's source window.
See Also: